


Description
Pandas for Data Analysis: Python, EDA & Excel Reporting. This course is an application that helps learners clean, exploratory analyze, and visualize raw, messy data using the Pandas library in Python, and turn it into clear reports and Excel outputs. This Python Pandas course takes learners from the concepts of Series and DataFrames to practical data cleaning, exploratory data analysis, and reporting. Students first learn stand-alone operations and then connect them to a workflow that starts with a question and ends with an explanation of what the data shows. In the Pandas Foundation section, students understand how to organize data in Series and DataFrames and practice selecting rows and columns, filtering records, sorting values, transforming data, and working with text, categories, and dates. It also teaches how to read and write common data formats, examine unfamiliar datasets, and identify the information needed before starting an analysis. In the cleaning and preparation phase of real datasets, challenges such as missing values, duplicates, inconsistent data types, and unusual observations are examined, and the selection of cleaning steps appropriate to the analytical question is practiced. Combining datasets, applying transformations, and using GroupBy operations to create meaningful summaries are also in the same vein. In the data exploration and interpretation of results section, exploratory data analysis is used to examine distributions, relationships, and differences between groups, and descriptive statistics, time-based analysis, and rolling operations are practiced. Learners learn to create visualizations, select appropriate chart types, explain discovered patterns, and communicate findings while considering uncertainty and limitations. In Applying Pandas to Business Problems, sales and customer datasets are examined, business metrics are calculated, and findings are organized into reports. Using Pandas and OpenPyXL to produce Excel outputs makes it easy to share the analysis, and hands-on projects, along with a final capstone, tie together skills into a complete analysis. You will also learn how to work with datasets in Kaggle and Google Colab, explore Datawrapper and Flourish to communicate findings, and use ChatGPT and Gemini to help with Pandas coding and debugging, emphasizing the verification of code and AI-generated conclusions against the dataset, calculations, and requirements. The path is summarized in an iterative workflow: ask a question, load data, review it, clean, analyze, visualize findings, and communicate results.
What you will learn
- Using Series and DataFrames in Python Pandas to organize, select, filter, sort, and transform tabular data
- Explore unfamiliar datasets and apply data cleaning techniques in Pandas to handle missing values, process text, and adjust data types.
- Analyze data using descriptive statistics and the GroupBy operation in Pandas for aggregation, transformation, and filtering
- Creating data visualizations with Pandas including line, bar, scatter, box, area, and density plots
- Read and write CSV, Excel, and JSON files and work with dates, timestamps, rolling windows, and expanding calculations
- Applying data analysis skills with Python to Pandas projects including sales reporting and employee performance analysis
This course is suitable for people who:
- Aspiring data analysts who want to learn how to use Pandas for data analysis
- Data scientists who want to add Pandas to their skill set
- Business analysts who need to analyze data using Pandas
- Programmers who want to learn data manipulation and analysis with Python and Pandas
- Those interested in learning Pandas and data analysis with Python, including Pandas beginners, students, researchers, and business professionals with basic Python knowledge
Pandas for Data Analysis: Python EDA & Excel Reporting Course Details
- Publisher: Udemy
- Instructor: Faisal Zamir , Jafri Code , Pro Python Support
- Training level: Beginner to advanced
- Training duration: 11 hours and 37 minutes
Course syllabus as of 2026/9
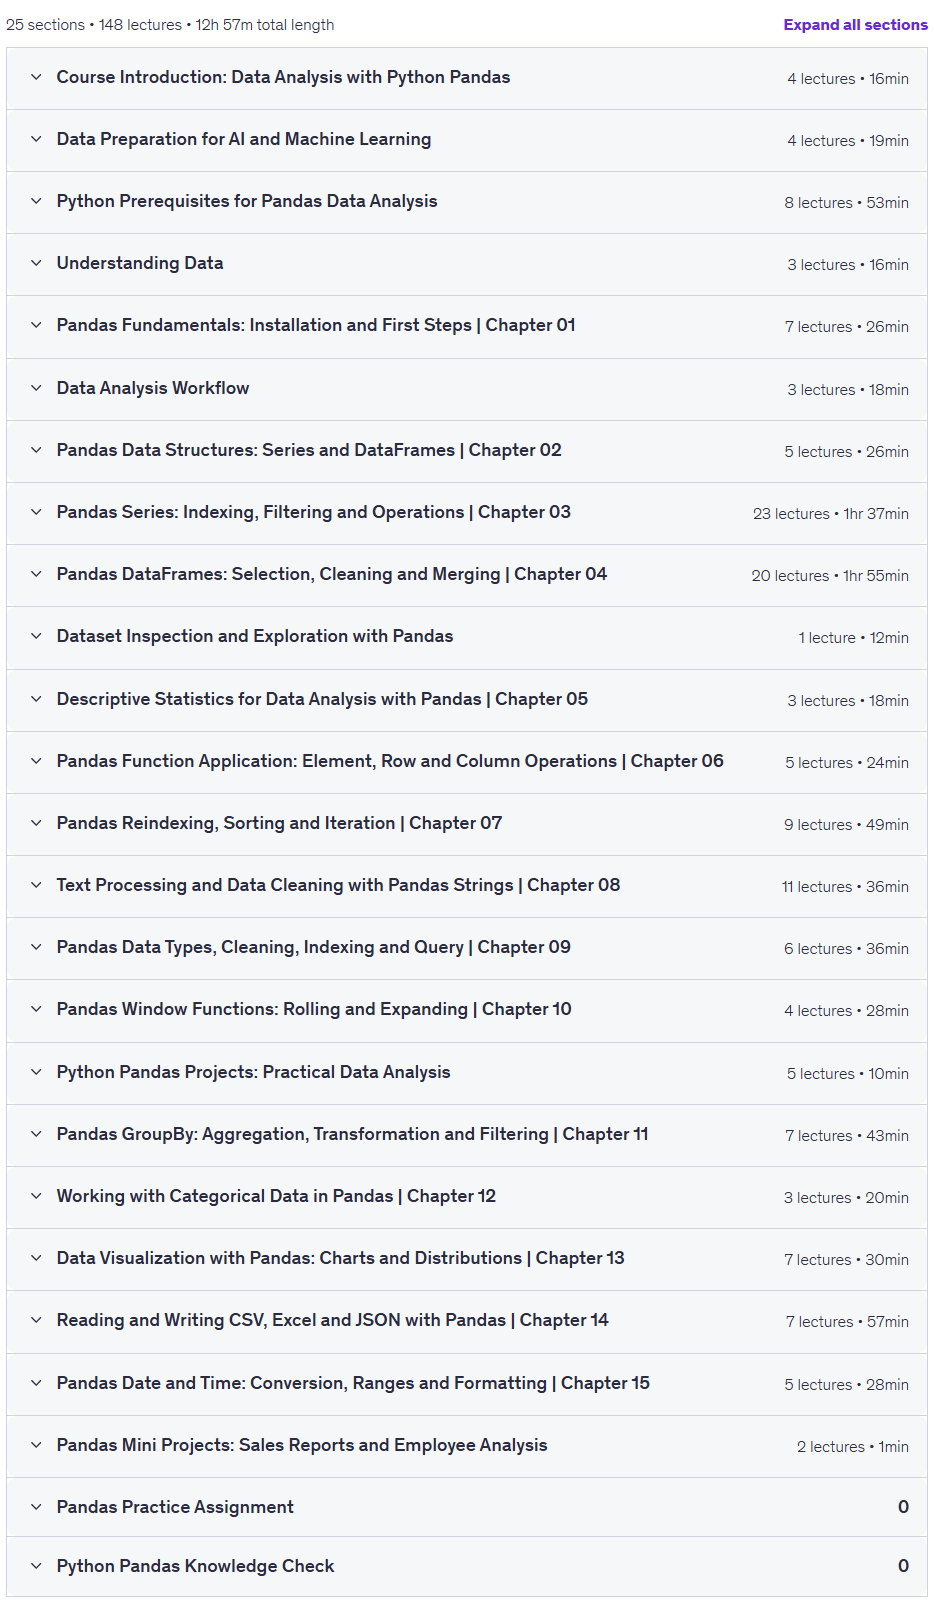
Prerequisites for the Pandas for Data Analysis: Python EDA & Excel Reporting course
- You should have basic knowledge of Python programming with beginner experience
- You did not have to buy extra software or courses
Course images
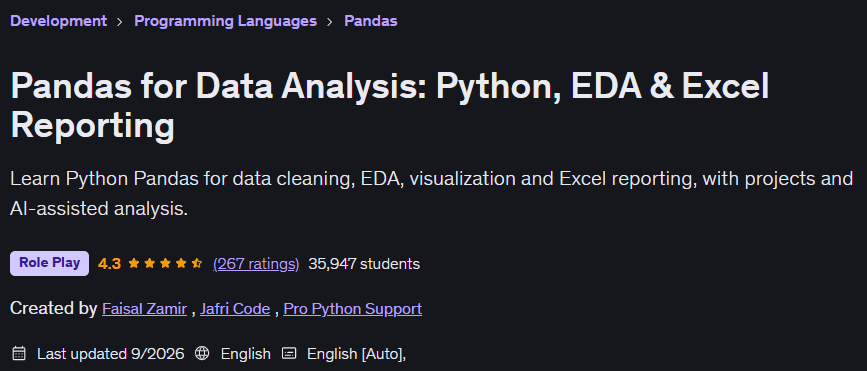
Sample course video
Installation Guide
After Extract, view with your favorite player.
Subtitles: None
Quality: 1080p
Download link
Rapidgator link
File(s) password: www.downloadly.ir
File size
4.08 GB