


Descriptions
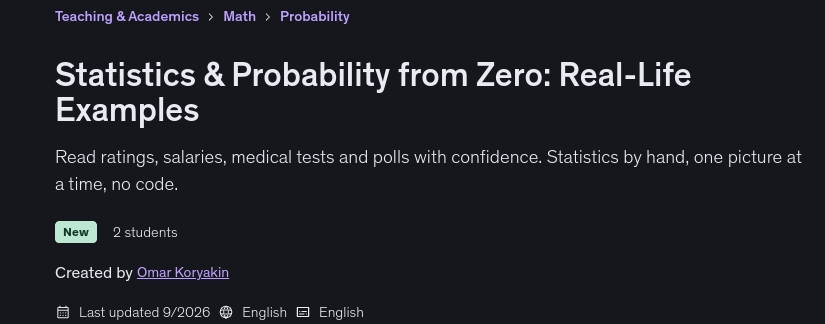
Statistics & Probability from Zero: Real-Life Examples, This course contains the use of artificial intelligence. Have you ever looked at a number in a report, a news story, or a doctor’s letter and felt your mind go blank? This course is for that moment. We start from zero, and by the end, you’ll be able to look at almost any number someone shows you and ask the three questions that matter: How many values are behind it? How spread out are they? And how likely is it to be due to luck? We begin with real life, not formulas. You’ll work out why a restaurant with 4.9 stars from 12 reviews is less trustworthy than one with 4.6 stars from 3,100 reviews. You’ll see why an “average salary” in a job advert can be a number that almost nobody earns, and why the median tells you more. You’ll count 1,000 people using a simple tree diagram and find out that a positive result on a “90% accurate” test for a rare illness means only about an 8% chance that you’re actually ill. And you’ll read a poll that says 52%, plus or minus 3 points, and know whether the race is really decided.
The teaching is slow and patient on purpose. Every lesson starts with a situation you’ll recognise, explains the reason before the rule, and then walks through a worked example step by step with a picture you can see building on screen. After that, it’s your turn: you pause, try a short exercise yourself, and then we check the answer together. Each lesson also shows where you’ll encounter the idea at work or at home, as well as the classic mistake people make with it, so you can avoid falling into the same trap. All you need is everyday arithmetic: adding, subtracting, multiplying, dividing, and calculating percentages on a calculator.
What you’ll learn
- Judge a star rating or review score by reading it together with the number of reviews behind it.
- See through an ‘average salary’ or ‘average house price’ by calculating the median and identifying outliers.
- Calculate the mean, median, mode, range, and standard deviation by hand, and know which one answers your question.
- Use a z-score to describe how unusual a test result, a sales day, or a card payment really is.
- Work out the actual probability of combined events using a dice grid, a Venn diagram, and a tree diagram.
- Explain what a positive medical test really means when the illness is rare, and why base rates matter.
- Read a poll’s ‘plus or minus 3 points’ margin and determine when a race is too close to call.
- Build a 95% confidence interval and run a complete hypothesis test, ending with a conclusion in plain English.
- Identify a correlation that does not imply causation, fit a simple prediction line, and question a ‘hot streak’.
- Spot misleading charts and headlines, such as a bar chart with a cropped axis or a story claiming that ‘most X were Y’.
Who this course is for
- Complete beginners who freeze when a report, a news story, or a doctor presents them with numbers.
- Career switchers moving into data analysis or data science who want solid foundations before learning the tools.
- Office staff and managers who read dashboards, sales reports, or survey results and want to question them properly.
- Students taking an introductory statistics module at school, college, or university who need concepts explained slowly.
- Parents who want to understand school reports, percentiles, and test scores, and help their children with maths.
- Traders, investors, and curious readers who want to understand risk, averages, probability, and statistically ‘significant’ results.
Specificatoin of Statistics & Probability from Zero: Real-Life Examples
- Publisher : Udemy
- Teacher : Omar Koryakin
- Language : English
- Level : Beginner
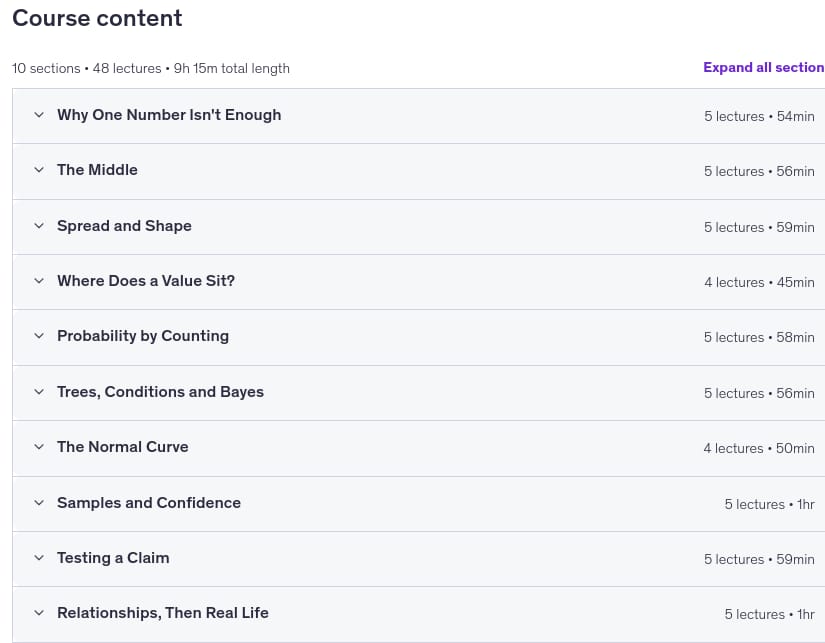
- Number of Course : 48
- Duration : 9 hours and 15 minutes
Content of Statistics & Probability from Zero: Real-Life Examples
Requirements
- Everyday arithmetic: adding, subtracting, multiplying, dividing and working out a percentage
- A basic calculator (the one on your phone is fine) and some paper and a pen for the practice exercises
- No previous statistics, algebra or software experience is needed; every word and symbol is explained from scratch
- Willingness to pause the video and try each short exercise before watching the answer
Pictures
Sample Clip
Installation Guide
Extract the files and watch with your favorite player
Subtitle : English
Quality: 720p
Download Links
Password file(s): www.downloadly.ir
File size
10.92 GB