


Description
Exploratory Data Analysis with Python. This course is a how-to course on exploring, understanding, cleaning, and analyzing datasets using Python, published by LinkedIn Online Academy. It is aimed at data analysts, data scientists, Python developers, and students. It focuses on uncovering patterns, relationships, trends, anomalies, and data quality issues before applying advanced statistical or machine learning techniques, and treats exploration as a systematic first step, not something to be rushed through. Throughout the course, learners work with powerful Python libraries such as Pandas, NumPy, Matplotlib, and Seaborn, and begin by systematically exploring a new dataset, understanding its shape, structure, and the types of data it contains before drawing any conclusions. This initial exploration phase is considered essential grounding and helps learners avoid the common mistake of jumping straight into analysis without really understanding what they are working with. The course then moves on to descriptive and statistical analysis, teaching learners how to summarize data sets numerically and identify key features such as central tendency, dispersion, and the shape of the distribution.
Learners then delve into individual variables in depth, studying the behavior of individual columns on their own, before expanding to multivariate analysis, which examines how multiple variables interact and influence each other. Correlation analysis forms a significant part of the course, helping learners understand which variables move together, which relationships may be meaningful, and which could be random or misleading. Throughout these steps, learners are continually trained to watch for anomalies and data quality issues, as problems not identified at this stage tend to confound any subsequent analysis. Visualization is woven throughout the course rather than being considered an end-all, and learners use Matplotlib and Seaborn to build meaningful graphs that reveal patterns that aren’t always obvious from the raw numbers alone. By the end of the course, learners will have a solid, practical foundation in exploratory data analysis that will prepare them to confidently progress into more advanced statistical or machine learning work.
What you will learn in Exploratory Data Analysis with Python.:
- Python (Programming Language)
- Data Analysis
- Exploratory Data Analysis
- and …
Course specifications
Publisher: LinkedIn
Instructors: Anaconda, Inc
Language: English
Level: Intermediate
Number of Lessons: 35
Duration: 3h 13m
Course topics
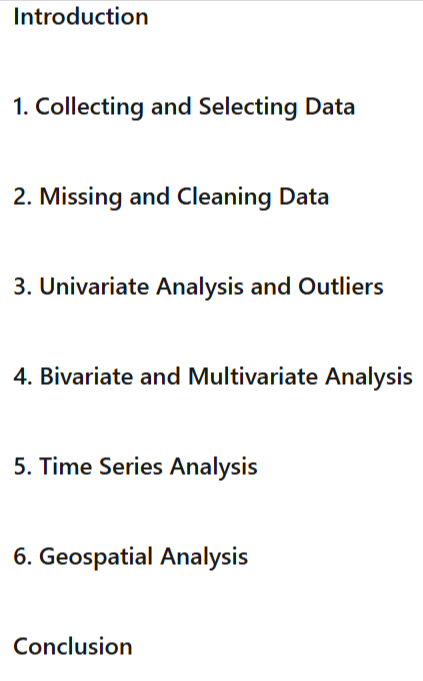
Exploratory Data Analysis with Python. Prerequisites
None
Pictures
Exploratory Data Analysis with Python. introduction video
Installation guide
After Extract, watch with your favorite Player.
English subtitle
Quality: 720p
Downloadly link
Rapidgator link
File password (s): www.downloadly.ir
Size
595 MB