


Description
2026 Python Data Analysis & Visualization Masterclass is a data analysis and illustration course with Python programming language, published by Udemy Academy. Python is a high-level, multi-purpose programming language used in a variety of industries and disciplines, and based on a variety of frameworks. One of the most important specialized applications of Python is data analysis and illustration. Among the most important Python libraries and frameworks in the field of data analysis are Pandas, Matplotlib, and Seaborn. Data science is one of the basic and very important sciences and is used in many industries and technology-based fields such as machine learning, deep learning, economic analysis, web application development, etc.
The course instructor has used his best effort and creativity so that the videos of this training course are short and compact and their duration does not exceed 15 minutes. At the end of each educational topic, you will be faced with a set of exercises and purposeful problems, the solution of which plays a very important role in a deep understanding of the content. The training process of the course is completely project-oriented and you will work on real data sets such as the best-selling products of Amazon, stock prices in different time periods, historical bitcoin data, etc. Visual illustration and graphic drawing of data in the form of various diagrams in line with other topics of the advanced course and the user will show the results while analyzing the data.
What you will learn in 2026 Python Data Analysis & Visualization Masterclass
- Series and Dataframes in Pandas
- Visualize information and create various graphical representations with Seaborn
- Analysis of real data sets in various fields such as stock prices, sales and …
- Draw various diagrams with Matplotlib library
- Various techniques for organizing, filtering, clearing, compressing, and analyzing data frames
- Hierarchical Indexing
- Integrate various information sets with the Pandas Library
- Build a variety of information plots
Course specifications
- Publisher : Udemy
- Teacher : Colt Steele
- Language: English
- Level : Beginner
- Lectures : 204
- Duration : 20 hours and 30 minutes
Course topics
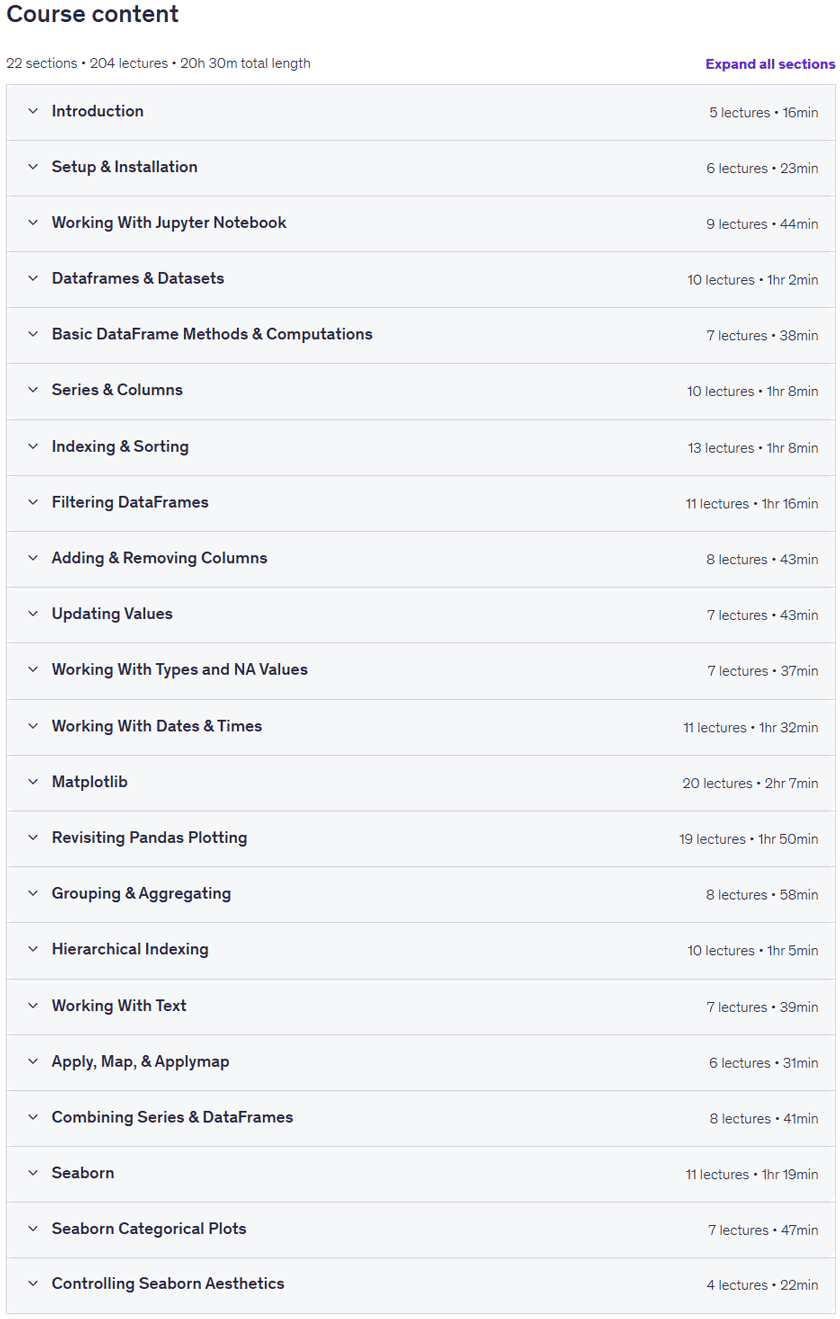
2026 Python Data Analysis & Visualization Masterclass Prerequisites
Basic Python Knowledge (variables, conditionals, etc)
Pictures

2026 Python Data Analysis & Visualization Masterclass Introduction Video
Installation guide
After Extract, watch with your favorite Player.
Subtitle: English
Quality: 1080p
Changes:
The version of 2023/4 compared to 2021/12: 3 lessons for 16 minutes has increased.
The 2025/6 version has not changed in terms of the number of lessons and time compared to 2023/4, but it has been updated after 2 years.
Version 2026/1 compared to 2025/6 has increased by 2 lessons and 1 minute in duration. The course quality has also been increased from 720p to 1080p.
Download Links
Downloadly
Rapidgator
Password file(s): www.downloadly.ir
Size
12.2 GB
6 Comments. Leave new
Hi! Rapidgator links, please
Hi
Added
Rapidgator 1GB part, please! 😀
Hi
Added
please update this code.
Hi
There is no change in total length in update 2024/9