

Description
The “Ultimate Data Analytics and Visualization Bundle: 10 Courses” is an educational program—published by the online academy Udemy—that covers the essential skills required to transform raw data into meaningful insights. This comprehensive training bundle introduces you to the fundamental concepts of data analysis, as well as the tools and techniques used for collecting, processing, analyzing, interpreting, and visualizing data across various industries. You will explore key areas such as data cleaning, statistical analysis, exploratory data analysis (EDA), data modeling, and dashboard creation, discovering how visualization tools can turn complex datasets into clear, actionable information. You will learn to identify trends, recognize patterns, measure performance, and communicate your findings effectively through charts, reports, and interactive dashboards. Throughout the course, you will master the creation of PivotTables, the use of the Fields pane, the addition of standard and calculated fields, number formatting within PivotTables, and various methods for summarizing data.
The curriculum also covers the creation of PivotCharts, the addition of sparklines and slicers, and the consolidation of data from multiple worksheets into a single PivotTable. Using Power BI, you will build interactive, visually appealing dashboards, share your analyses and dashboards via Power BI Online, and import Excel, text, and CSV files into Power BI Desktop. You will learn about data modeling, different types of relationships, and how to troubleshoot relationship issues, as well as how to set up a shared workspace within the Power BI Service. Furthermore, using Tableau, you will construct advanced visualizations—such as pie, sunburst, bump, funnel, candlestick, and Sankey charts—connect to and manage data sources, and develop comprehensive dashboards. With Alteryx, you will build workflows to eliminate repetitive tasks, perform data cleaning and manipulation, and explore machine learning and the Alteryx Intelligence Suite. Additionally, using Qlik Sense, you will learn how to become a professional designer and leverage its geospatial analysis tools. This 10-course bundle offers a comprehensive learning experience designed to boost your confidence in working with data and delivering insights—whether you are a beginner, a student, or a professional looking to enhance your analytical capabilities.
What you will learn in Ultimate Data Analytics and Visualization Bundle: 10 Courses:
- How to create PivotTables.
- Using the fields pane and adding fields and calculated fields.
- Formatting numbers in PivotTable.
- Different ways to summarize data.
- Creating PivotCharts and adding sparklines and slicers.
- and …
Course specifications
Publisher: Udemy
Instructors: Simon Sez IT
Language: English
Level: Introductory to Advanced
Number of Lessons: 428
Duration: 53 hours and 53 minutes
Course topics
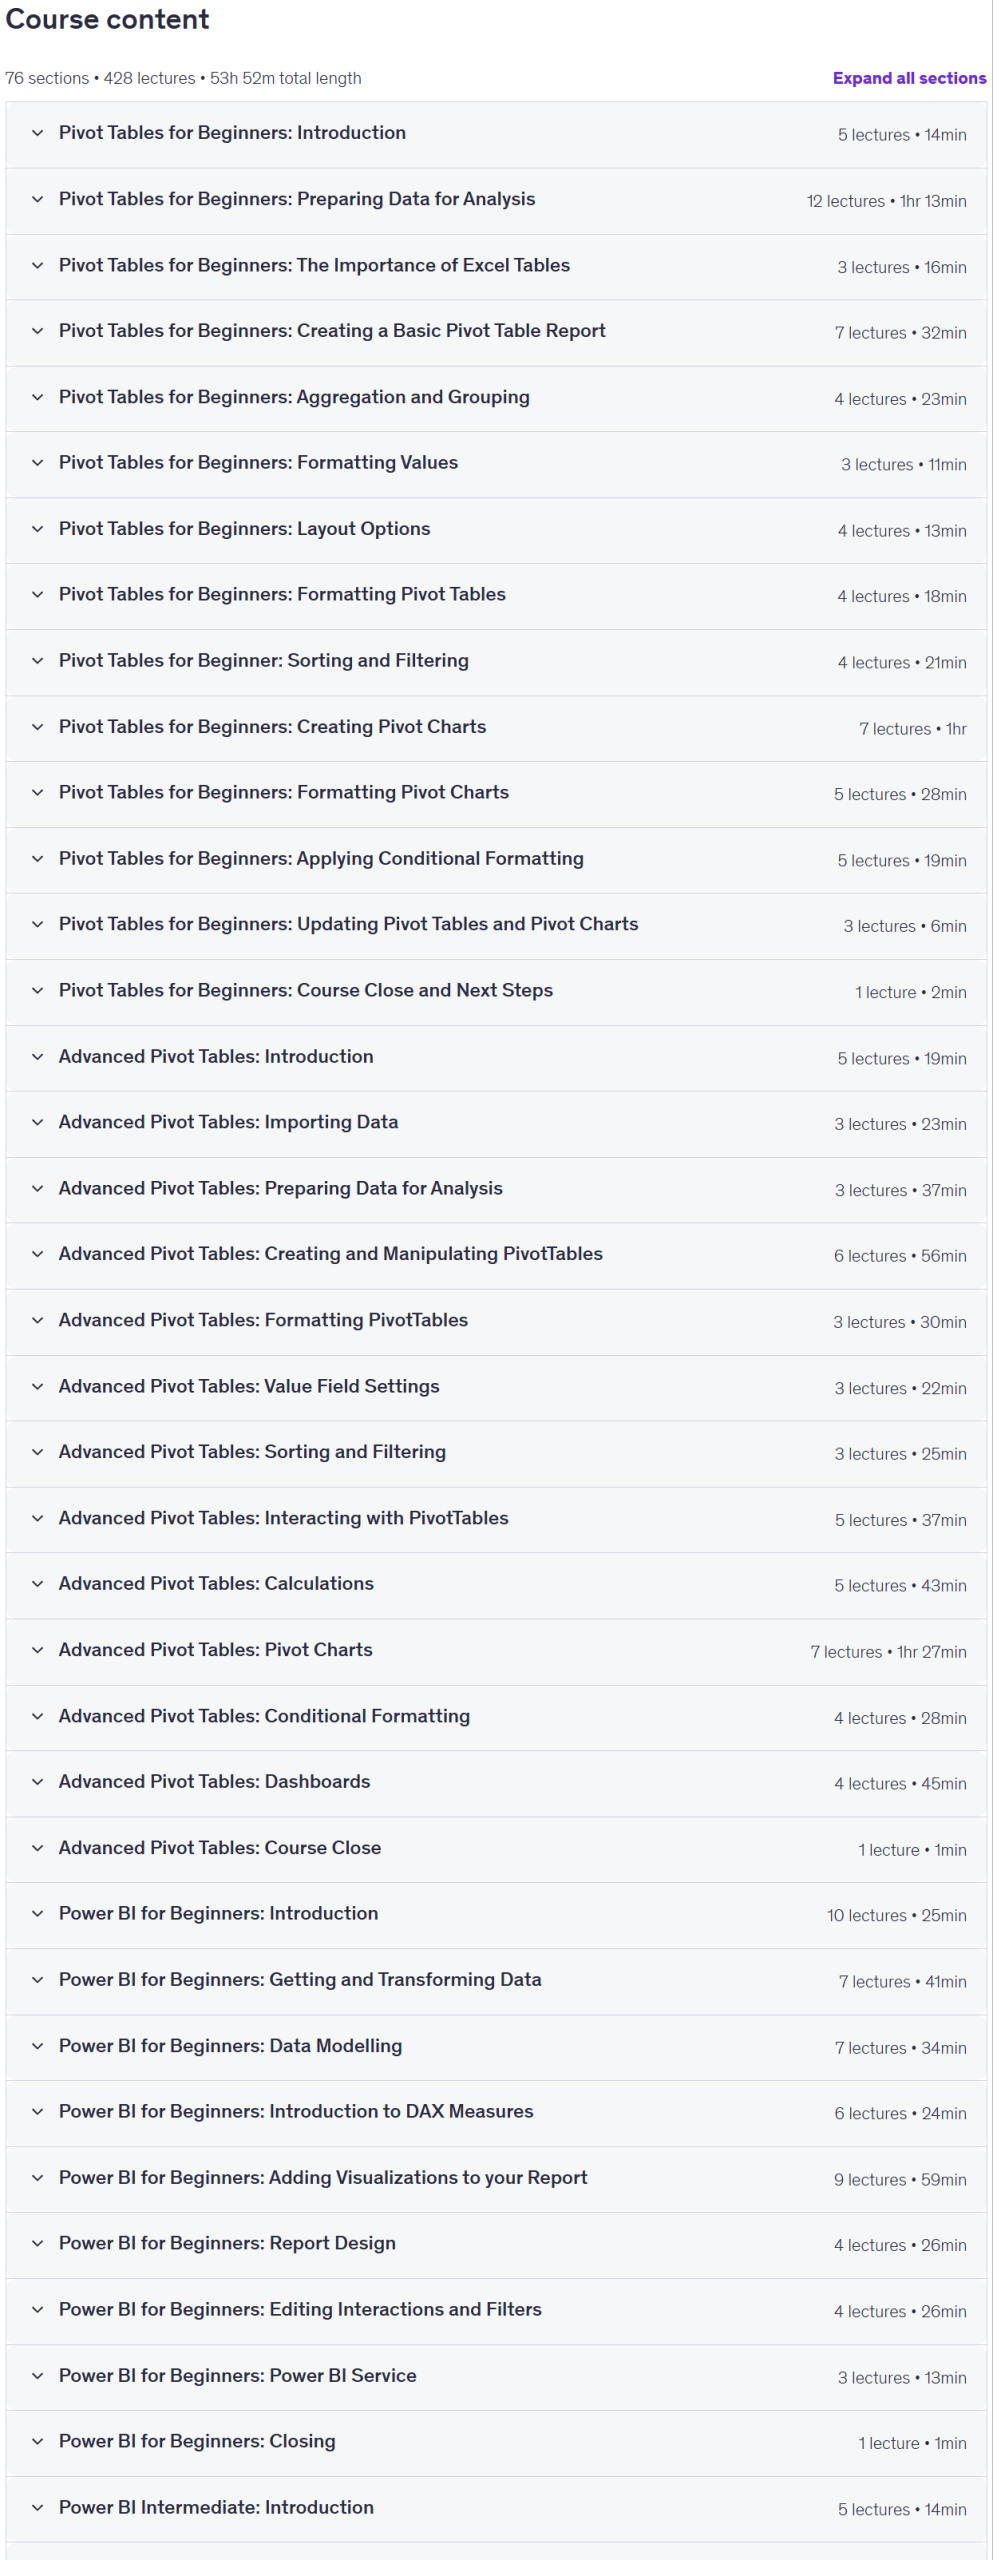
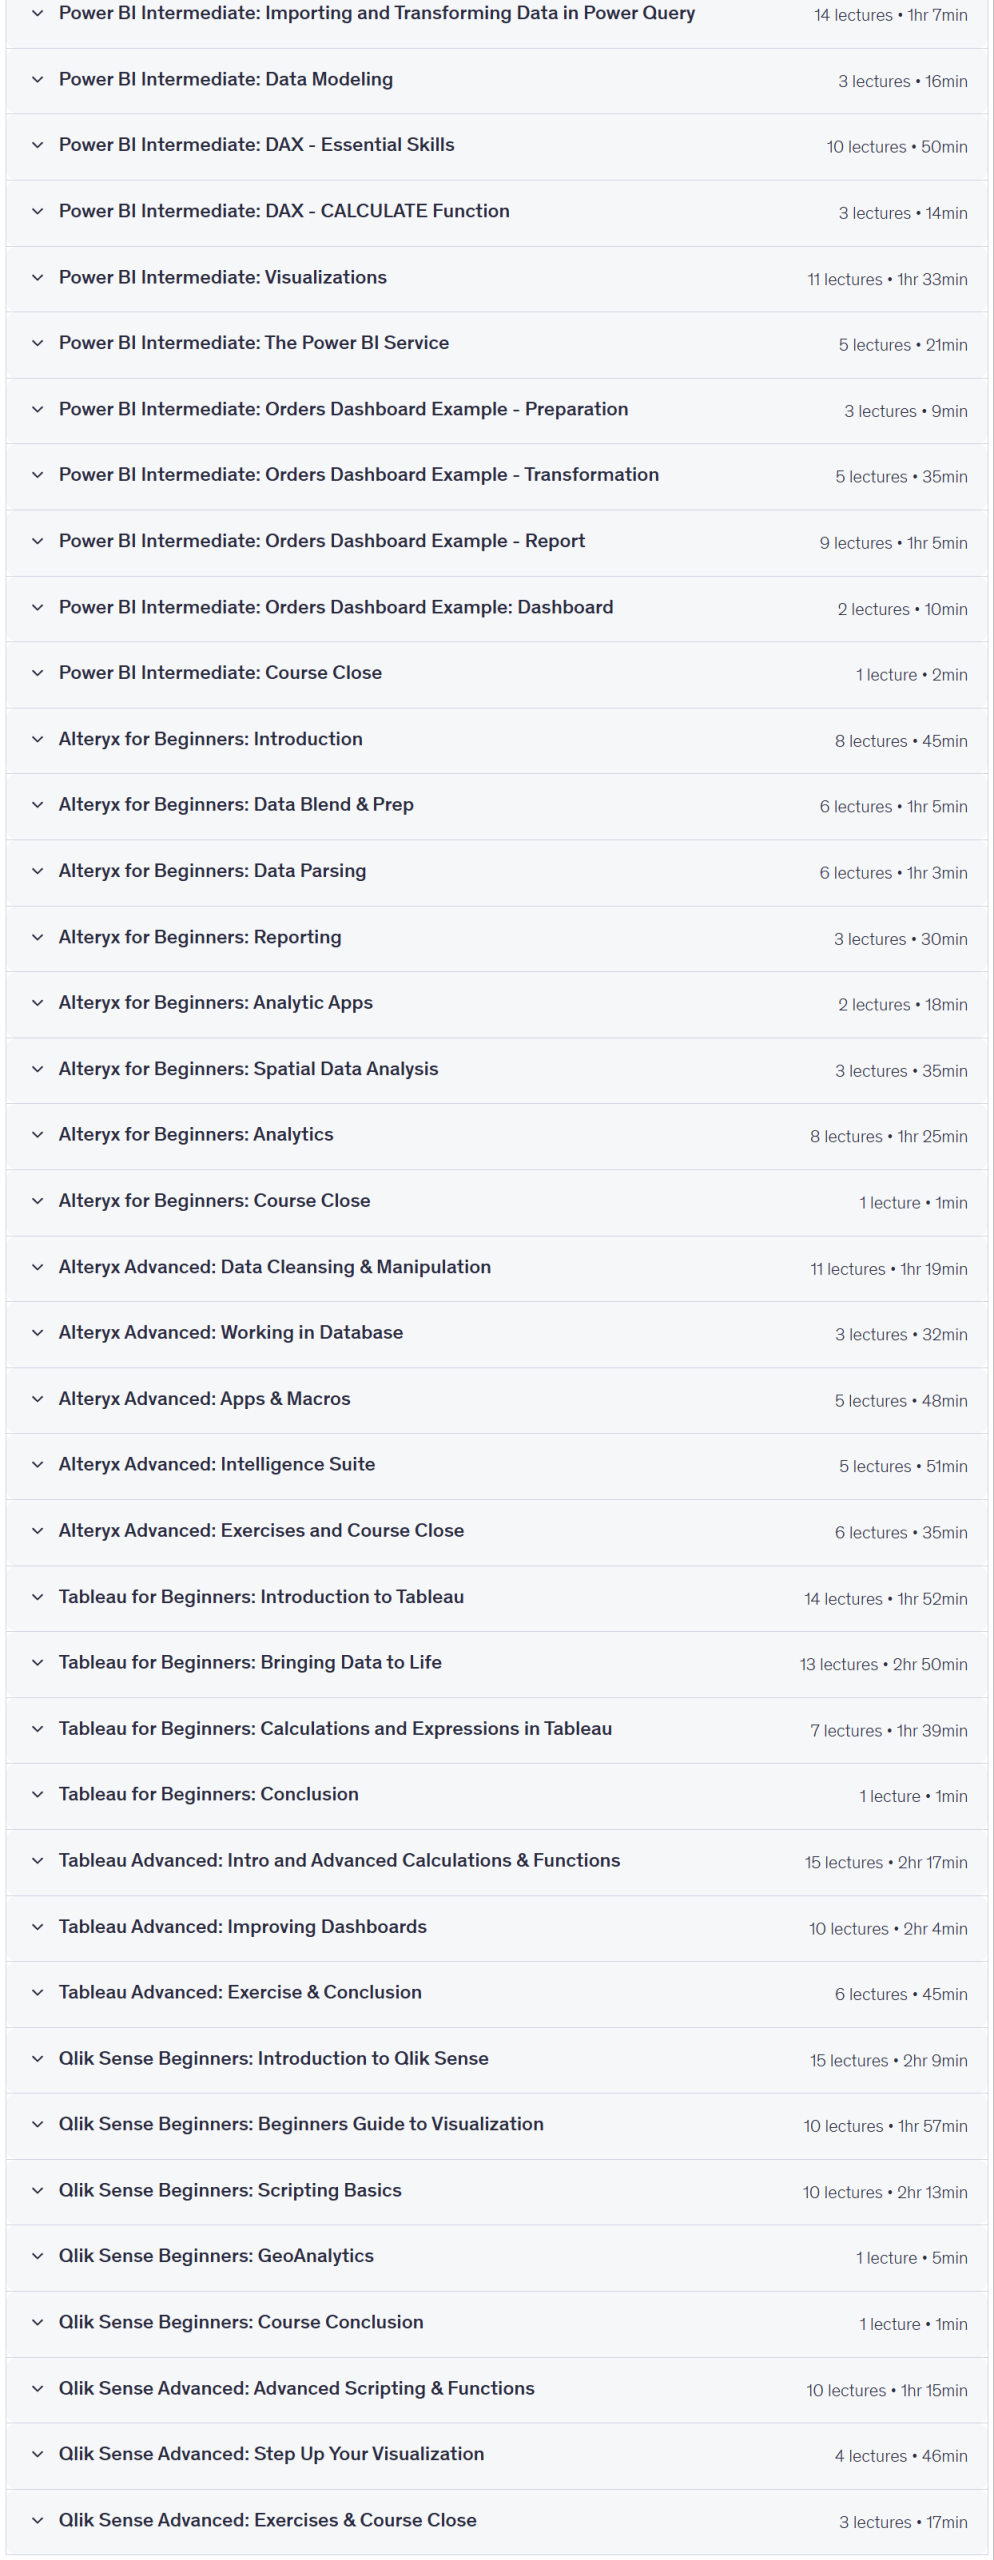
Ultimate Data Analytics and Visualization Bundle: 10 Courses Prerequisites
Access to the relevant software/application is beneficial (Excel, Power BI, Tableau Desktop, Alteryx, and Qlik Sense)
Basic to intermediate knowledge of Microsoft Excel is needed
An understanding of data analytics is beneficial
Pictures
Ultimate Data Analytics and Visualization Bundle: 10 Courses introduction video
Installation guide
After Extract, watch with your favorite Player.
English subtitle
Quality: 720p
Downloadly link
Rapidgator link
File password (s): www.downloadly.ir
Size
22.1 GB