


Descriptions
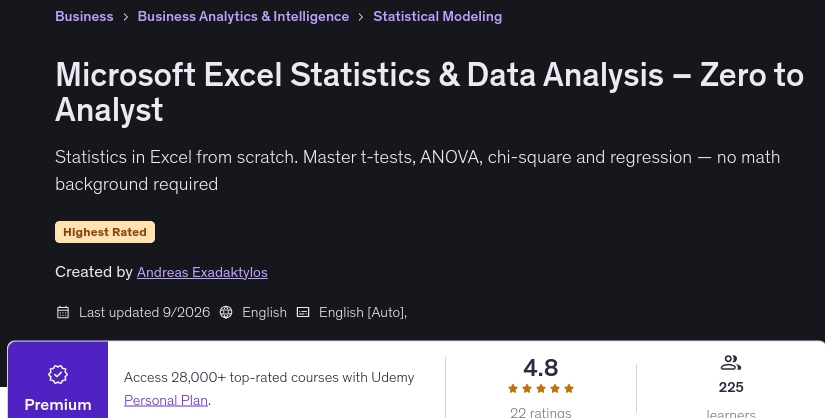
Microsoft Excel Statistics & Data Analysis – Zero to Analyst, Imagine opening Excel and facing a dataset filled with sales figures, survey results, website traffic, or exam scores. You know there is valuable information hidden in the data, but you are not sure how to prove it or use it to make sound decisions. Welcome to Microsoft Excel Statistics & Data Analysis – Zero to Analyst, a practical, hands-on course designed to take you from uncertainty about spreadsheets to confidently explaining decisions with data. The course teaches statistics entirely through Excel workflows, without requiring Python, R, expensive software, a mathematics degree, or prior knowledge of statistics. Instead of teaching statistical techniques through disconnected examples, the course follows a continuous business scenario in which you work as a junior analyst at BrightRoast Coffee, a fictional chain with 200 stores. You will investigate questions from Maria, the Head of Analytics, and complete 10 practical exercises modeled on the tasks an entry-level analyst might encounter during their first week on the job. Each exercise includes a self-check so you can verify your work.
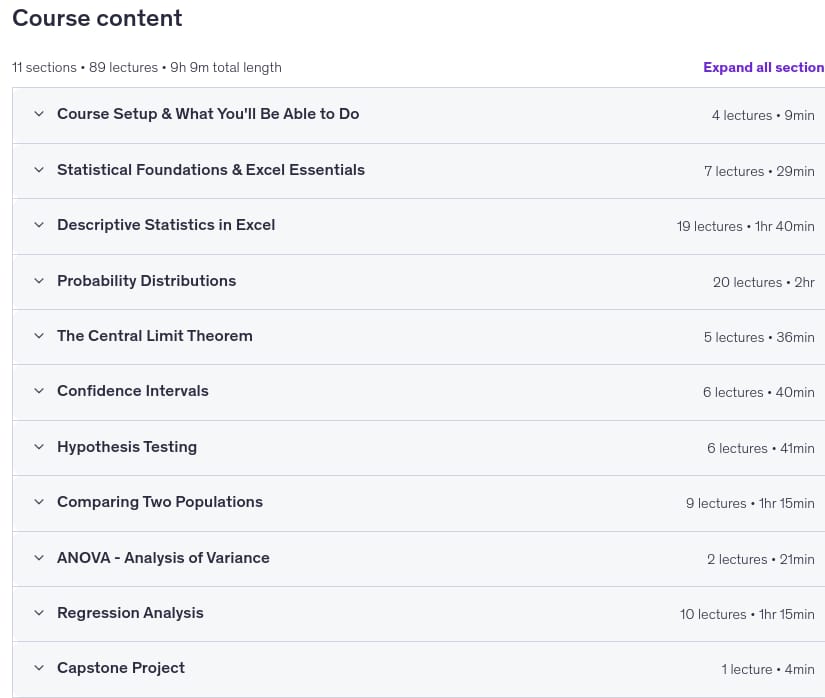
The curriculum begins with statistical foundations, samples and populations, descriptive and inferential statistics, and essential Excel skills such as absolute references, Tables, and Flash Fill. You will then study descriptive statistics, including mean, median, mode, range, standard deviation, IQR, z-scores, the Empirical Rule, histograms, boxplots, outlier detection, and the Data Analysis ToolPak. Further topics include probability, permutations and combinations, binomial, Poisson, and normal distributions, the Central Limit Theorem, standard errors, confidence intervals, hypothesis testing, p-values, Type I and Type II errors, one-tailed and two-tailed tests, two-sample tests, t-tests, z-tests, F-tests, ANOVA, chi-square tests, effect sizes, correlation, and simple and multiple regression. You will also learn regression diagnostics, interpret R-squared and adjusted R-squared, and make predictions with prediction intervals. The course includes more than 80 focused video lectures, downloadable Excel workbooks used in the lessons, 10 hands-on exercises with challenge and solution worksheets, and practice quizzes after each section. Section checkpoints help you track the skills you have developed. By the end, you will be able to analyze real-world data in Excel and communicate statistical findings in clear business language that supports practical decisions.
What you’ll learn
- Master Excel statistics from the ground up, without a mathematics degree, prior statistics knowledge, or Python.
- Describe datasets confidently using the mean, median, standard deviation, z-scores, IQR, and boxplots.
- Use binomial and Poisson distributions to solve real business problems, such as analyzing defect rates and calls per hour.
- Apply the Central Limit Theorem, one of the most useful concepts in statistics.
- Construct 95% confidence intervals for means and proportions and explain what they mean.
- Perform a wide range of hypothesis tests, including t-tests, z-tests, paired t-tests, F-tests, ANOVA, and chi-square tests.
- Build simple and multiple regression models in Excel, including model diagnostics and predictions.
- Use the Data Analysis ToolPak to perform statistical tests, interpret their outputs, and draw conclusions.
- Complete 10 hands-on exercises based on realistic first-week analyst tasks at a fictional coffee chain.
- Translate statistical findings into clear business language that executives can use to make decisions.
Who this course is for
- Excel users in marketing, operations, sales, human resources, or finance who want to make data-driven decisions.
- Anyone preparing for an analyst, data analyst, or business analyst role who needs a foundation in statistics.
- Students who studied statistics in the past, have forgotten much of it, and want to learn practical applications.
- Complete beginners with no previous experience in statistics; the course starts from zero.
- Excel users who encounter terms such as p-value, confidence interval, and regression and want to understand them properly.
- Business professionals who want to interpret data independently instead of relying on others.
Specificatoin of Microsoft Excel Statistics & Data Analysis – Zero to Analyst
- Publisher : Udemy
- Teacher : Andreas Exadaktylos
- Language: English
- Level : All Levels
- Lectures : 89
- Duration : 9 hours and 9 minutes
Content of Microsoft Excel Statistics & Data Analysis – Zero to Analyst
Requirements
- Excel 2016 or later including Excel for Microsoft 365, Excel Online, and Mac versions
- Basic Excel comfort: opening files, entering formulas, navigating worksheets (nothing advanced)
- No prior statistics knowledge required we cover everything from scratch
- About 30-40 minutes a day for two to three weeks (or work at your own pace)
- A willingness to actually open Excel and follow along this is a hands-on course
Pictures
Sample Clip
Installation Guide
Extract the files and watch with your favorite player
Subtitle : English
Quality: 1080p
The 2026/9 version the duration has decreased by 4 minutes compared to 2026/7.
Download Links
Password file(s): www.downloadly.ir
File size
7.03 GB